How to really speed up your Xamarin Forms apps for Android.
Since ever, one of the most annoying problems of Xamarin Forms on Android was the start up time. A native app takes nothing while even the most basic Xamarin forms apps takes several seconds to show up on Android.
During the years Xamarin has tried hard to make things better, sometimes with very small improvements and other times with a bit better improvements but now with the new Visual Studio release (> 16.5) they did something amazing, something called Startup Tracing with custom Profiles.
Startup Tracing
I’m not going into many details here as the only thing that matters is how we can improve the performances of our Xamarin Forms apps for Android. So I’ll be very clear here. If you go into the Android Options of your Xamarin projects, you’ll see this:
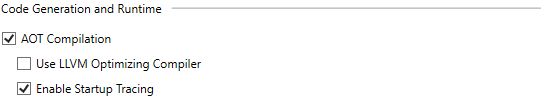
If you enable the AOT Compilation (Ahead of time), your app performances will improve significantly and so the startup time, but your apk size will increase as well. At this point you can decide what is more important for you, performances or apk size.
Don’t answer yet, there is a solution
Since Visual Studio 2019 Version 16.2 you were able to enable the Startup Tracing. If you enable this option, the profiler will do its magic (memory, execution time and some stats) to create a profile for your app to increase the performances without affecting too much your apk size.
According to Xamarin (you can read the full post here), these are the results of enabling these options:
| Type | Startup Speed | APK Size |
| Normal | 2s914ms | 16.1 MB |
| AOT | 1s18ms | 34.6 MB |
| Startup Tracing | 1s518ms | 20.1 MB |
It means that AOT is amazing and you should enable it but if you care about the apk size you should definitely enable the Startup tracing as well, so you’ll get an incredible startup speed improvement without affecting too much your apk size.
Amazing but now it’s even better
Since Visual Studio 16.5 (or Visual Studio for Mac 8.5), Xamarin did even better and trust me, the result is more than amazing. I was really impressed by it so do a favour to yourself and continue to read!
We can now generate a Custom Profile of our app! If we do that, the next time our app will run in no time (Cool cool cool cool cool…cit.).
Unfortunately for now there is no UI to generate a Custom Profile (hopefully Microsoft will do it soon), but I’ll show you how to generate your Custom Profile in no time. I’ll try to keep it as easy as I can and as usual, if you have questions or issues, leave a comment here and I’ll reply as soon as possible.
Generate a Custom Profile
Follow this short guide and you’ll get your Custom Profile in no time and you’ll really improve the performances of your Xamarin Forms apps for Android.
- Open a command prompt in the directory that contains your Android *.csproj file.
- Connect one (and only one) Android device to your computer.
- In your Android manifest enable the INTERNET permission.
- Write and run this command: msbuild /t:BuildAndStartAotProfiling
- Run your app until is completely loaded (don’t press or do anything on your app!!!).
- Write and run this command: msbuild /t:FinishAotProfiling (* if you have problems read just below these points)
- This will create the file custom.aprof to your Android project. Now change the Build Action of this file to AndroidAotProfile.
- Last step is to add two new properties to your Release configuration:
<PropertyGroup>
    <AndroidEnableProfiledAot>true</AndroidEnableProfiledAot>
    <AndroidUseDefaultAotProfile>false</AndroidUseDefaultAotProfile>
</PropertyGroup>
Enjoy your new amazing performances!
ONLY IN CASE OF ERROR: When running the command msbuild /t:FinishAotProfiling some people (I had it as well on one of my machines) get the error:
aotprofile-tool: Unable to read profile through local port: 9999
If you do, open the Command prompt with admin privileges and (always in the folder containing you Android .csproj file) write:
set PATH=%PATH%;"C:\Program Files (x86)\Android\android-sdk\platform-tools"
msbuild -t:FinishAotProfiling
This will solve the problem and you will be able to have your custom profile.
Again according to Xamarin (you can read it here) this is the result of their tests:
| Release | Release/AOT | Release/Startup Tracing (Default) | Release/Startup Tracing(Custom) | |
| Activity Displayed | 4863ms | 2086ms | 3655ms | 1900ms |
| APK Size | 48MB | 95MB | 57MB | 60MB |
Conclusions
I’ve personally tried the Startup Tracing with Custom Profiles and trust me, the results are impressive, the first time i couldn’t believe my eyes. When we enable these options we can finally obtain startup performances very similar to a native app (similar, not the same…yet!) so may suggestion here is to enable AOT and Startup Tracing and to create a Custom Profile for every project you are going to create! My suggestion is add this page as preferite as you will need it for every project you are going to create. As usual, add a comment and I’ll try to reply asap!
Xamarin Android Nursery Size – Ask Android Questions
August 24, 2021 @ 10:43 pm
[…] changes might make a difference. The most significant change was creating a custom trace profile Marco Troncone’s post (which works great but adds a third to the size of the package). I used adb logcat to capture the […]
March 23, 2021 @ 12:32 pm
Thanks!
So to be safe, I guess I could best run msbuild /p:Configuration=Release /t:BuildAndStartAotProfiling?
March 23, 2021 @ 12:15 pm
Thanks a lot Marco, this really helps!
Three questions;
– Does it matter if the Android Project is set to Debug or Release when running msbuild /t:BuildAndStartAotProfiling?
– Do you need to have AotAssemblies set to true (in Debug and/or Release) before running msbuild /t:BuildAndStartAotProfiling?
– Do you need to run msbuild /t:BuildAndStartAotProfiling everytime you make changes to your app?
Thanks for your help!
March 23, 2021 @ 12:25 pm
You are very welcome.
1) use the release mode.
2) enable it in release and then run the msbuild
3) if it’s a minor change, no, if you change many things, especially what you use when the project starts, then it would make sense to run it again.
I hope it helps
Marco
February 15, 2021 @ 5:10 pm
Yes, the difference in speed is incredible. I enable in in every app I write. Of course the space is a drawback but I prefer to have a faster app than saving few MB. I don’t think that we will see any changes given that now the focus is on MAUI rather than Xamarin, but I definitely suggest to enable and configure the custom startup tracing
February 14, 2021 @ 7:53 am
Wow. Startup speed is astonishing difference. Only one drawback is app size is could be increased. Any others? Why it is not by default
April 15, 2020 @ 3:13 pm
Unfortunately ‘sudo msbuild /t:FinishAotProfiling’ command return me error:
EXEC : error : aotprofile-tool: Unable to read profile through local port: 9999
https://github.com/xamarin/xamarin-android/issues/4152
April 19, 2020 @ 10:26 am
Hi Matteo,
You can solve the problem you are having doing these additional steps:
open the Command Prompt with Admin privileges and write this:
set PATH=%PATH%;”C:\Program Files (x86)\Android\android-sdk\platform-tools”
msbuild -t:FinishAotProfiling
it will work (I’ve personally tested it)
Let me know if it worked for you.
Cheers,
Marco
April 20, 2020 @ 7:08 pm
Hi Marco,
I use Visual Studio for Mac
I should try the solution here https://github.com/xamarin/xamarin-android/issues/4566
Thanks!
April 13, 2020 @ 6:15 pm
In the article: “Again according to Xamarin (you can read it here) this is the result of their tests:”
->
“You can read it here” – is missing the link(?)
April 13, 2020 @ 6:19 pm
Thanks, I’ve fixed it now.
April 13, 2020 @ 6:13 pm
Sounds great!
My APK will contain both arm32 and arm64 (to target all possible devices) libs.
If my phone is e.g. 64bit, then only the arm64 libs will be used.
Following your steps, custom.aprof will be created only for 64bit only?
April 13, 2020 @ 6:32 pm
I think we can only generate one custom profile.
I could be wrong but I haven’t seen anything on multiple custom profiles.
What this profile does is to check what code the app is running at startup trying to optimise it loading only what needed.
I guess that probably this could be common to both the architecture so we don’t have to worry about it.
April 13, 2020 @ 6:49 pm
“trying to optimise” – you mean it will AOT them?
As it should be done for all ABI in case of multiple.
It’s a good question, based on 1 profile, will it do for all ABI?
If I am not fully misunderstand it…